Table of Contents
- Introduction
- The Basics
- Financials
- Financial Ratios
- Managing Growth
- Acquisitions
Financial Relationships: How to Understand Financial Data
What's in this chapter
You now know what a debit is, what a credit is, what an asset is, what a liability is, etc. You have all the basic building blocks you need to have an educated conversation with an accountant. You should even feel comfortable analyzing basic financial information. The next step in this journey is to get a bit more sophisticated by starting to develop an understanding of the key relationships you need to be thinking about. And relationships (or pattern matching) is the key to analyzing and understanding financial information.
For example, let's start with a real-life P&L. The following information is a summarized and rounded version of a real company's financials to give us something to work with:

Let's pretend that the numbers are in millions, so net income is $4 million (you can change the rounding to whatever you want - it's not important). Is $4mm good or bad? You might think $4mm is great if it's your company and that's your take-home pay. But what if instead of $104 million in revenue, your company had $104 billion instead? Would you still be happy with $4 million in net income? Probably not! Right now your company is running at about a 3.8% net profit margin ($4mm / $104mm). That's not razor-thin, but it is a bit tight (some industries are just like that). But if you had to generate $104 billion in revenue to generate $4 million in sales, your company would be at a 0.0038% margin (4 ÷ 104,000). That is razor-thin and likely something you would try to improve significantly.
You might have noticed that there were two relationships that we referred to in the previous paragraph:
- The relationship between net profit and revenue.
- The relationship between our net profit % and our competitors net profit %.
Looking at net profit in isolation won't give you all the information you need. But even looking at it in the context of your revenue still won't give you everything you need! If you are in an industry that typically has low margins (e.g., groceries, trucking, etc.), 3.8% might be best-of-breed. But if you are in an industry with high margins (e.g., software, legal services, etc.), 3.8% might be considered a complete failure. In this chapter, we'll start to build your analytical muscle, but you'll need to continue to exercise it by continuing to branch out and understand additional relationships that will put your numbers in the context they need.
Profitability Ratios
Many books that discuss ratios start with balance sheet ratios or liquidity ratios. We will get to those, but as a CFO I almost always found myself discuss profitability ratios first. So we'll start there.
Net Income Percent
We've already discussed this one in the preamble to this chapter. It's easy to calculate (net profit ÷ revenue) and easy to understand. And for many companies, this is the most important profitability ratio. It tells you how much profit you get to keep from every $1 in sales. A higher net profit % is generally better. In my experience, 10–20% net margins are pretty normal, but I've certainly seen worse (e.g., 3%) and I've definitely seen better (e.g., 30%). Your industry and its dynamics will have a big impact on your margins, so you should do more research if you want to know more about how you're doing relative to your competitors (e.g., check out IBISWorld if you're interested).
EBIT and EBITDA Percent
Recall from the profit and loss section that EBIT is "earnings before interest and taxes" and that EBITDA (also referred to as "operating profit") is "earnings before interest, taxes, depreciation, and amortization." Your EBIT percent is equal to EBIT ÷ Revenue and your EBITDA percent is equal to EBITDA ÷ revenue. This is an important metric because it allows you to understand the profitability of your company while ignoring its capital structure (i.e., how much debt it has/does not have) as well as its taxes. This lets you focus in on the business's operating performance without getting bogged down with how much debt the business has (which you can control or change if needed separate and apart from the business itself) or how much it pays in taxes (which you can try to manage, but it has nothing to do with the business itself).
This is also an important metric for private equity firms for two reasons:
- They typically borrow money to buy a business. By focusing on the operating profitability of the business, they can reason about how easily the business will be able to pay back its debt.
- When they purchase the business, they typically pay a higher price than the carrying value of the assets on the company's balance sheet. When this happens, accounting rules force you to ascribe value to the excess. You then amortize the excess value in the P&L over a period of time. This is not a "real" expense in the sense that there is no cash outlay for it (the private equity firm already paid for it when they bought the business) and it has nothing to with the operating profitability of the business itself.
As a business owner, you probably won't see amortization on your P&L too often, but you may see depreciation expense depending on the type of business you run. So, I recommend that you calculate the EBIT percent, but you may want to stay away from EBITDA percent unless you have a good reason not to.
Marketing and Growth Metrics
Understanding profitability is key to running a successful business because it is the ultimate arbiter of how much money you'll make. A higher net income % equals higher profitability. But, as usual, this only tells part of the story. You'll only learn how much profit you'll make per dollar of revenue. You get to normalize profitability so you can understand if you are doing a good job managing the business. While you'd likely be dissatisfied generating $4 million in profit in a year on $100 billion in revenue, you'd be equally dissatisfied with earning $400 from $1,000 in revenue over a year. The absolute dollars matter, so you need to know the math behind the engine that grows your business. That's what we'll cover in this section.
Customer Acquisition Cost (CAC)
This is a very easy metric to calculate: marketing costs ÷ new customers. It tells you how much it costs to acquire a new customer. For example, assume that you spent $1,000 on Google Ads last month and that is the only channel you use to acquire customers. You ended up with 10 new customers from your marketing efforts, so it cost you $100 to acquire each new customer ($1,000 ÷ 10).
The hard part in calculating this metric is not the math, but the effort that goes into determining how many new customers you acquired from each marketing channel you use. If you don't use many marketing channels, aren't very big, and you track customer sign-ups closely, you can probably calculate this easily. If not, here are some things you should think about to get the most out of this metric:
- Tag new customers with their acquisition channel. If someone signs up from a Google Ad campaign, tag that customer in your database with that channel. If they came from a direct mail campaign, tag them with that channel. Etc.
- Tag new customers with the month (and possibly even the week or day) that they signed up. Financial statements normally get created on a monthly basis, so you should at least flag the month that the customer was acquired so you can perform the calculation over time. This is often called the customers vintage.
- Perform experiments over time to see what happens to your CAC. If you spend more money by deviating a bit from your "core" customer, what happens to your CAC?
Getting this right gets harder the longer you don't track this information, so you start tracking the better!
Lifetime Value (LTV)
Once you know your CAC, you can start to think about some more interesting statistics like customer lifetime value. A customer's "lifetime value" tells you how much a new customer is "worth" to you. Strategic Database Marketing suggests that you create a table to calculate a customers LTV which is a good approach. We'll simplify the table a bit here, but you will need the following information to calculate your customer's LTV:
- Average revenue per customer by year. This is simply the average amount of money your customer spends in each year that they purchase from you. For example, they might purchase $100 worth of goods in year 1, $150 in year 2, etc.
- Your gross profit margin. Recall, this is the percent of revenue you get to retain after accounting for cost of goods sold. For example, if you run a candy store, purchased candy for $40, and you were able to sell it for $100, you have a gross profit margin of 60% ($100 - $40 = $60 ÷ $100).
- Your CAC (see previous section).
- Your retention rate by year. This is a percentage value that is equal to the proportion of customers that continue to buy from you year-after-year. For example, if you acquired 1,000 customers in year 1 and 600 of those customers continued to purchase from you in year 2, you had a year 1 retention rate of 60% (600 ÷ 1,000). If 300 purchased from you in year 3, you had a 50% year 2 retention rate (300 ÷ 600). It doesn't matter if the customers that purchase from you in year 3 are the same customers that purchased from you in year 2 (e.g., maybe someone skipped a year). It only matters that they were part of the original year 1 vintage.
- A "discount rate." You can think of the discount rate as a number that helps weight near-term cash flow more heavily than long-term cash flow. For example, if I offered you $100 today or $100 a year from now, you would certainly prefer the former because it gives you immediate access to the cash. You can buy something now, invest the money and (hopefully) have more a year from now, etc. The discount factor is a mathematical trick that can help you make decisions about which offer you would prefer. For example, you might be indifferent to receiving $100 today or $125 next year. We divide the future cash flow ($125) by the discount rate to get the "present value" of the future cash flow. So, in this case, the discount rate at the end of year 1 is 1.25 because $125 / 1.25 = $100. You calculate the discount rate based on the interest rate you assign to the project. For example, you might say think that spending money on marketing to acquire customers is very risky if you haven't tried it before, so you would assign a higher interest rate to the project (e.g., maybe 25%). Or you might think that it is not very risky at all because you've done it 100 times and had very consistent results, so you might assign a low rate (e.g., 8%). You shouldn't assign a rate too low, because there are things that are definitely less risky than a marketing campaign (e.g., you can invest in US Treasuries and get a certain rate of interest ... this is called the "risk-free" rate).
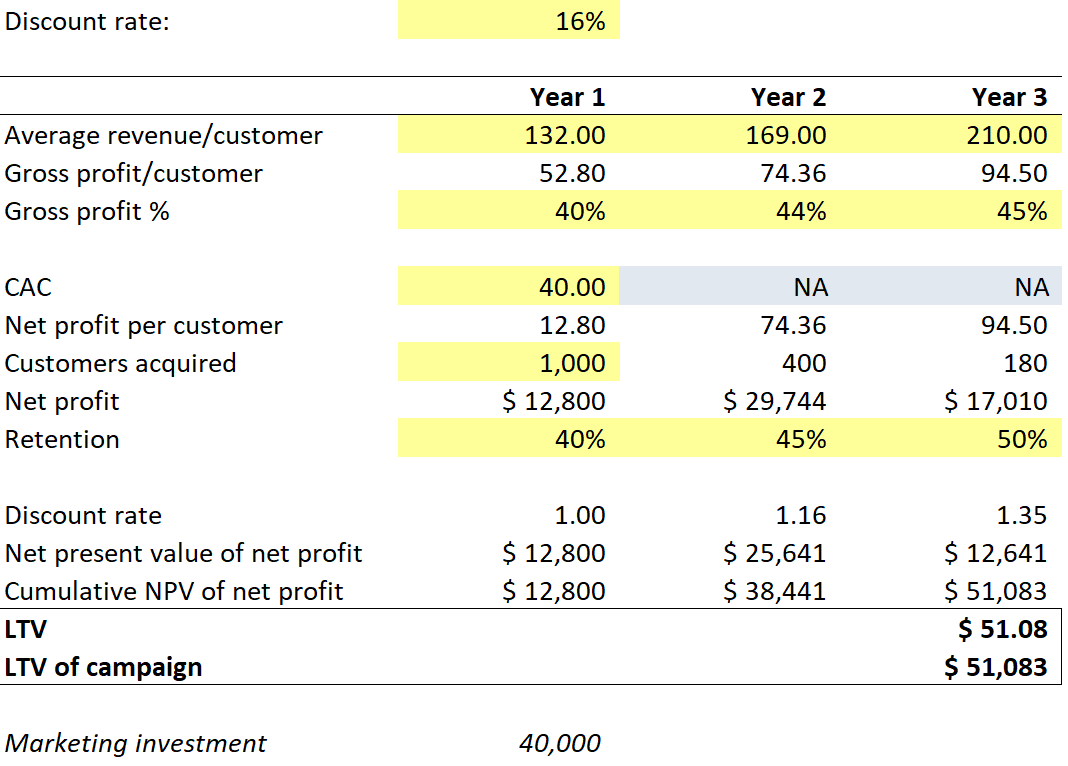
With these five pieces of information, you have everything you need to calculate LTV. It is sometimes helpful to think about the entire vintage since it makes some of the calculations simpler, but it's not strictly necessary:
Sales Velocity
Sales velocity ...